We first learned about this report from EdNC’s article New Interactive Map Shows How Learning Loss and Academic Recovery Varied by District in N.C. Check out their reporting for more on the state-level analysis.
A new report from Education Recovery Scorecard provides district-level data and analysis from across the United States on several measures pertaining to student achievement.
The report provides a trove of data that can be used to understand the effects of remote schooling, the additional money provided by the federal government, and other factors related to the pandemic affected students in each district. The report also highlights success stories of districts that have made significant progress in academic recovery. Additionally, the report includes recommendations from the researchers for states and districts regarding urgent academic recovery efforts to undertake before the federal spending deadline.
We eagerly searched through this report and in the District Fact Sheets to find out how the five school systems in our region were doing.
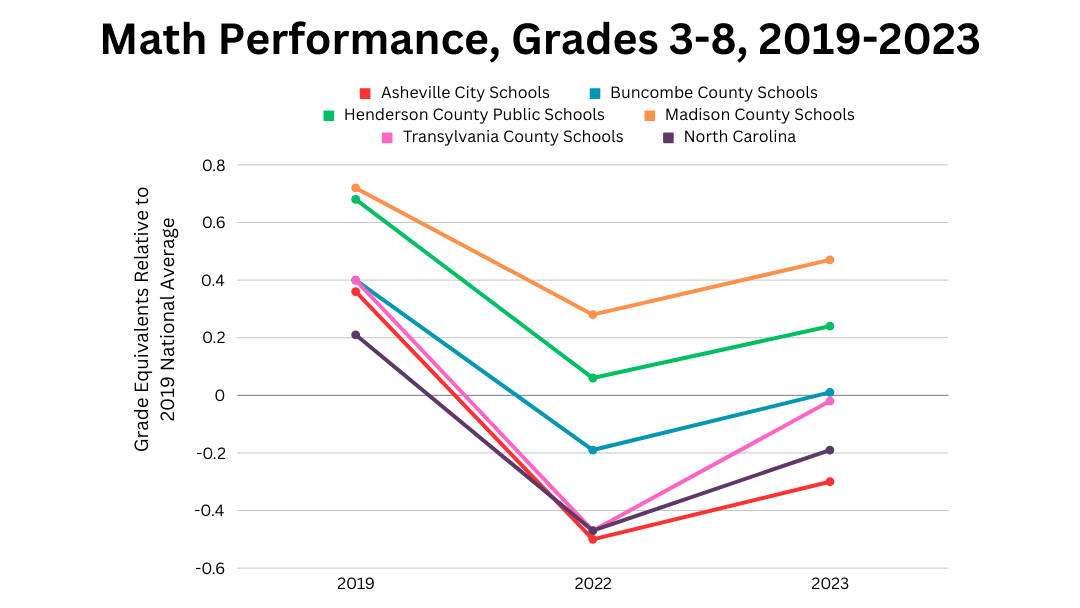
The chart above shows math scores in grade-level equivalents relative to the 2019 national average for grades 3-8. We included all five of our region’s school districts plus the state of North Carolina data for comparison. While the trends were clearly the same for five districts and for NC as a whole (i.e., steep losses from 2019-2022 and then partial recoveries from 2022-2023), the rate of those losses and recoveries differ.
Of the five districts in our region, Madison County Schools started with the highest average math scores prior to the pandemic, and their recovery so far has allowed them to retain the position of having the highest average math scores post-pandemic as well. Similarly, Asheville City Schools started with the lowest average math scores pre-pandemic and, although they have recovered some of their losses from the pandemic, they still have the lowest average math scores post-pandemic.
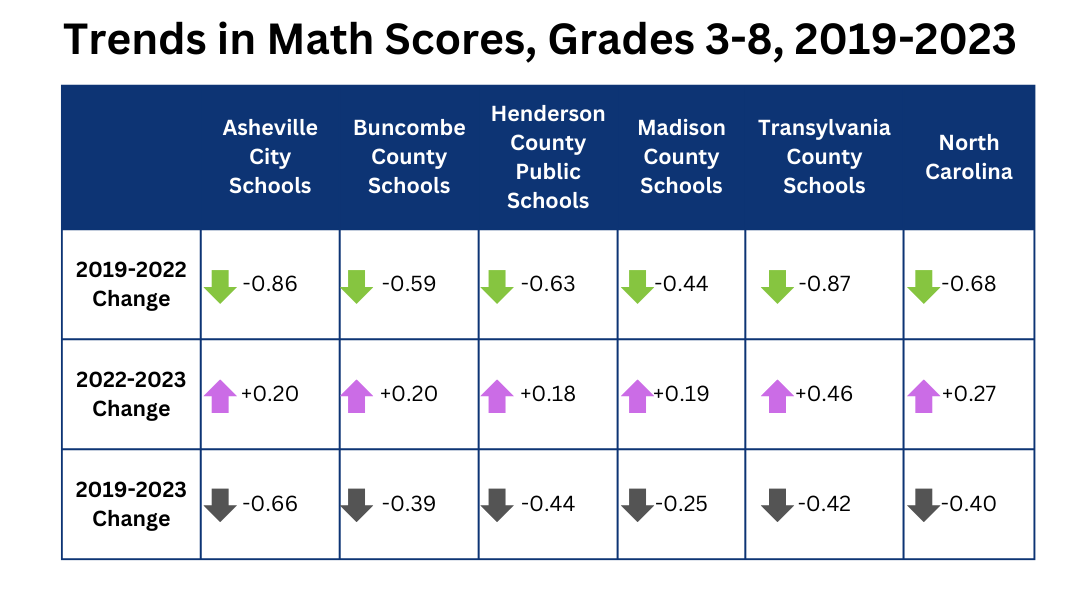
According to the data in the table above, students in Transylvania County Schools had the steepest regression from the pandemic, losing the equivalent of 87% of a grade level during the pandemic. Students in Madison County Schools regressed the least, losing the equivalent of 44% of a grade level–still nearly half a year’s worth of learning in math.
In the first year of post-pandemic academic recovery, Transylvania County Schools made the most substantial gains, recovering the equivalent of 46% of a grade level. Their rate of recovery was more than twice that of any other district in our region. Students in Henderson County Public Schools recovered the least–only about a fifth of a year’s worth of learning in math.
Asheville City Schools has the farthest to go in their recovery, having regained only about a third of their math learning losses. Madison County Schools has the smallest gap to close, at just one quarter of a year’s worth of math learning.
We can also use the data from the table above to calculate and compare the rates of academic recovery in math for each district and for the state of North Carolina. The data visualizations below show how much of the math learning losses each district has recovered so far, and how much recovery is still left.
Percent of Pandemic Learning Losses in Math That Have Been Recovered (by District and at the State Level)
%
Asheville City Schools
%
Buncombe County Schools
%
Henderson County Public Schools
%
Madison County Schools
%
Transylvania County Schools
%
North Carolina
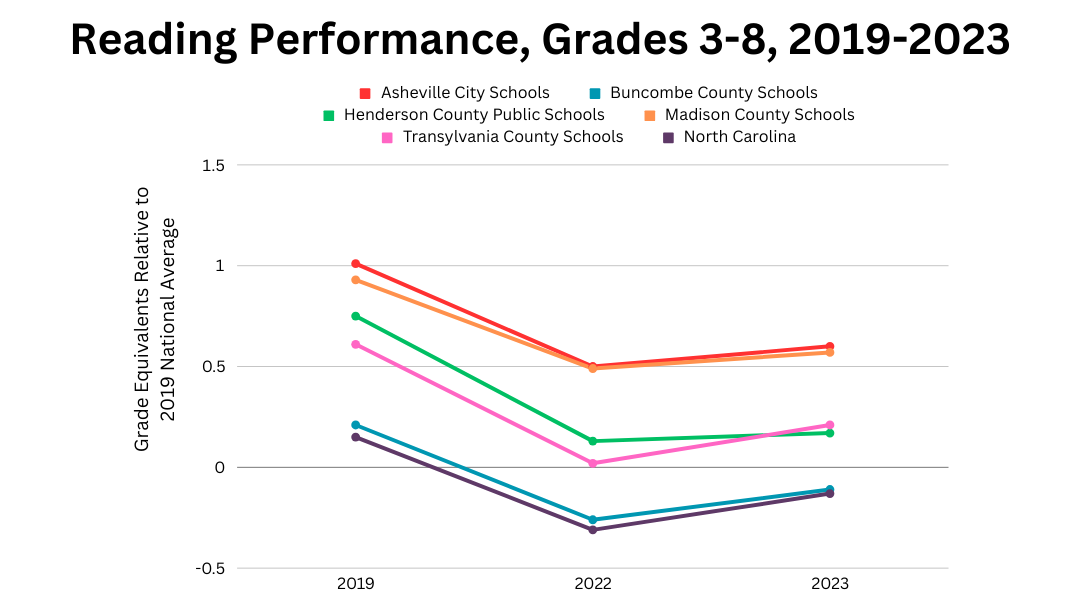
Let’s switch to the other major subject included in the report: reading. As with the chart of math performance, the chart above shows reading scores in grade-level equivalents relative to the 2019 national average for grades 3-8. Just like in the math chart, we included all five of our region’s school districts plus the state of North Carolina data in the reading chart. While the trends were clearly the same for five districts and for NC as a whole (i.e., losses from 2019-2022 and then partial recoveries from 2022-2023), the rate of those losses and recoveries differ. Notably, comparing the math performance chart to the reading performance chart, you can see that the declines in reading scores were not as steep as the declines in the math scores.
Compared to the math scores, we see a very different ordering of our districts with the reading scores. Asheville City Schools started with the highest average reading scores prior to the pandemic, and they have kept this position after one year of post-pandemic recovery efforts. Similarly, Buncombe County Schools started with the lowest average reading scores pre-pandemic, and they have maintained that position so far one year post-pandemic.
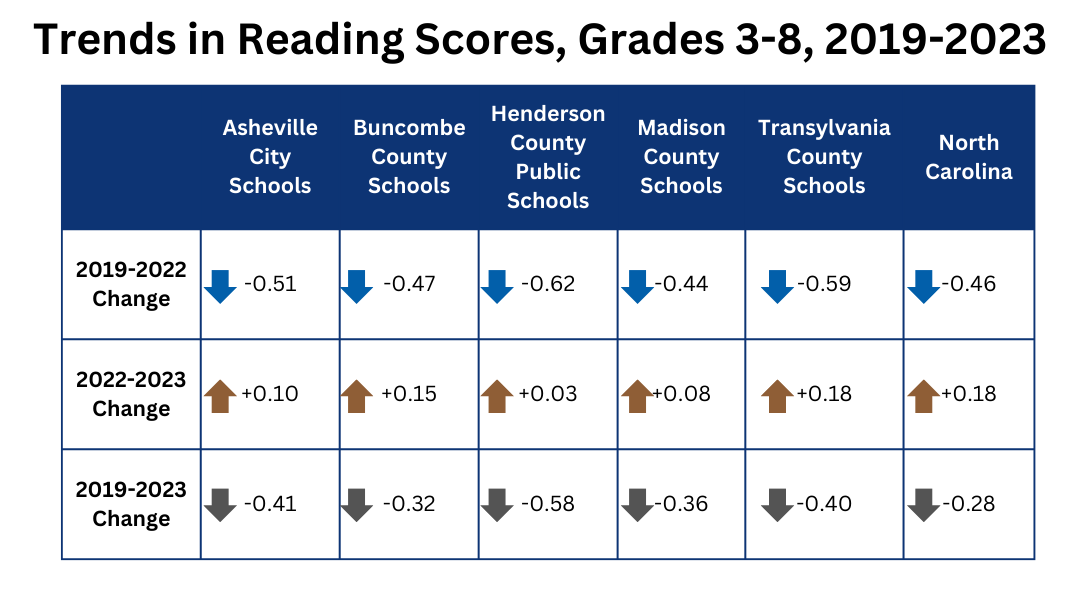
The table above shows that students in Henderson County Public Schools lost the most ground in reading during the pandemic: 62% (almost two-thirds) of a grade level from 2019-2022. Students in Madison County Schools lost the least of their reading skills, although still almost half a school year’s worth: 44% of a grade level.
As with the first year of post-pandemic academic recovery in math performance, Transylvania County Schools also had the most substantial gains in reading: 18% of a grade level (or about one-fifth of a school year). Students in Henderson County Public Schools had the smallest recovery in reading scores: 3% of a grade level (about five school days’ worth of learning).
Students in Henderson County Public Schools have the most ground to recover still in reading scores: they are still 58% behind their pre-pandemic levels. On the other hand, Buncombe County Schools has the least ground to regain in their reading scores, with just 32% of their pre- to post-pandemic reading gap remaining.
We calculated the rates of reading recovery scores for all five districts plus the state of North Carolina like we did for math scores. The data visualizations below show how much of the reading learning losses each district has recovered so far, and how much recovery is still left.
Percent of Pandemic Learning Losses in Reading That Have Been Recovered (by District and at the State Level)
%
Asheville City Schools
%
Buncombe County Schools
%
Henderson County Public Schools
%
Madison County Schools
%
Transylvania County Schools
%
North Carolina
It’s important to note that the data in this report only tell part of the story. Related factors that are not analyzed here include, but are certainly not limited to, how long each district operated with fully remote learning, how each district used its federal pandemic relief dollars, and what percentage of each district’s students are English-language learners (especially relevant for the reading performance data). We will continue to monitor our districts’ progress on recovering pandemic-related learning losses.
Data source for all the charts and tables in this post: NC District Fact Sheets from the Education Recovery Scorecard.
